Adaptive Testing for LLMs: Does It Really Work?

The standard approach to evaluating large language models (LLMs) is simple but inefficient: run models through massive static benchmarks, average the scores, and compare results. The problem is that these benchmarks often require models to process thousands of items, many of which offer little useful information about a model's actual capabilities.
Computerized Adaptive Testing (CAT) has been quietly transforming educational assessments for decades [1, 2, 3]. Rather than using a one-size-fits-all test, CAT adapts question difficulty in real time based on the test-taker’s performance. The concept is intuitive: start with a medium-difficulty question. If the answer is correct, try something harder. If it’s wrong, step back. In this way, the test adapts continually to pinpoint the test-taker’s ability efficiently.
CAT systems rely on Item Response Theory (IRT) as their mathematical foundation. Despite growing research interest in applying IRT to LLM evaluation [4, 5, 6, 7], adoption has been limited. This is both because tools are scarce, but also because estimating difficulty levels for every question, and keeping those estimates up to date with evolving capabilities of LLMs is a colossal task. Beyond practical obstacles, there are fundamental differences between evaluating humans and machines. Luckily, this is exactly the problem we’ve set out to solve at Trismik. Our new evaluation platform is designed for researchers and practitioners who want smarter, faster, and more scalable evaluations. Read Marco's post for more details.
In this blog post, we will give you some intuition about how adaptive testing works, and present some experiments. These findings are taken from our technical documentation, where you can find an in-depth analysis and more experimental results.
Understanding Adaptive Testing
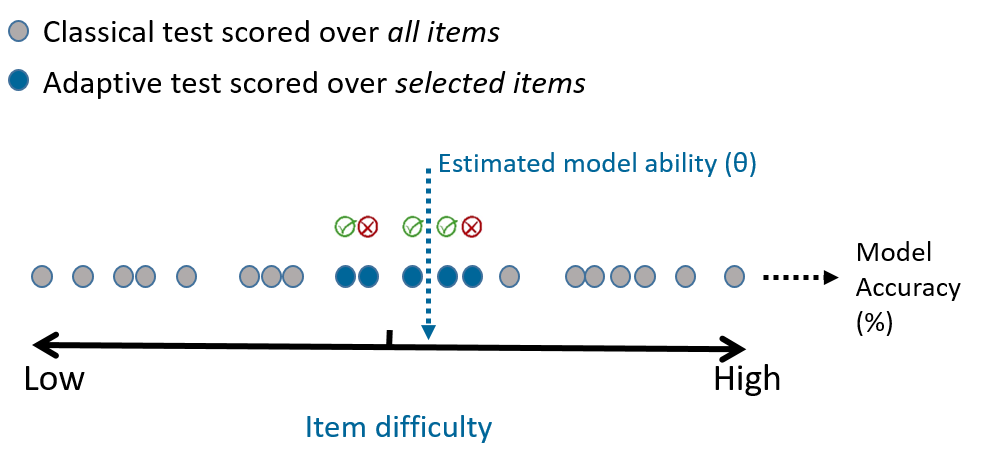
Unlike raw accuracy scores, which depend heavily on which questions are included in the test, IRT models aim to untangle two separate variables:
- The ability of the test taker (θ, or "theta"),
- The difficulty of each question.
The core insight is that some questions are more informative than others given what we know about the test-taker's ability so far. A question that's too easy or too difficult for the current ability estimate offers little value: you can often predict the outcome with high confidence. The most useful questions are those where the test-taker has about a 50% chance of answering correctly. These provide the maximum information for refining the ability estimate.
Can Adaptive Tests Recover Model Rankings?
One of the primary goals of model evaluation—evidenced by the popularity of leaderboards—is to rank models by performance on a given task. So we asked: How well does our adaptive testing algorithm recover model rankings compared to full-dataset accuracy?
Adaptive tests use fewer than 500 of the 5000+ questions, yet reliably recover model rankings.
A note on datasets: These are not the original benchmark datasets in their raw form. We’ve applied transformations to the questions and downsampled each set to achieve a balanced distribution of difficulty. This rebalancing lets us test the adaptive algorithm's performance more precisely. We’ll explore the why and the how in a future post—but for now, let’s look at the experiments.
Experiments: Classical vs Adaptive LLM Evaluation
We evaluated seven different models across five benchmark datasets using both classical and adaptive methods. Details on the experimental setup can be found here.
Accuracy vs θ
In traditional evaluations, accuracy is the go-to metric. But in IRT, the preferred metric is θ (theta)—a latent trait that represents a model's true ability. Unlike accuracy, θ is:
- Invariant to the specific mix of question difficulties,
- More stable across test samples,
- Enables adaptive selection of questions.
We expect θ-based rankings to align with accuracy rankings from full-dataset testing since higher-ability models should, on average, answer more questions correctly.
How did the rankings compare?
In the table below, you can find the results from the full-dataset classical evaluation (based on accuracy) and adaptive evaluation (based on average θ from five runs)
Spearman rank correlation between classical and adaptive evaluation results exceeded 0.96 for four of the five datasets.
| Model | Adaptive Rank | Classical Rank | Mean θ (n=5) | Accuracy |
|---|---|---|---|---|
| llama4-maverick-17b-instruct | 1 | 1 | 1.292 | 0.739 |
| gpt-4.1-nano | 2 | 2 | 1.290 | 0.717 |
| deepseek.r1 | 3 | 3 | 0.749 | 0.678 |
| gemini-1.5-flash | 4 | 4 | 0.606 | 0.628 |
| gpt-4o-mini | 5 | 5 | 0.409 | 0.603 |
| mixtral-8x7b-instruct | 6 | 6 | 0.165 | 0.565 |
| nova-micro | 7 | 7 | 0.136 | 0.532 |
| Model | Adaptive Rank | Classical Rank | Mean θ (n=5) | Accuracy |
|---|---|---|---|---|
| llama4-maverick-17b-instruct | 1 | 1 | 2.219 | 0.852 |
| deepseek.r1 | 2 | 2 | 1.757 | 0.797 |
| gpt-4.1-nano | 3 | 4 | 1.232 | 0.731 |
| nova-micro | 4 | 6 | 1.105 | 0.689 |
| gpt-4o-mini | 5 | 3 | 0.935 | 0.732 |
| gemini-1.5-flash | 6 | 5 | 0.863 | 0.724 |
| mixtral-8x7b-instruct | 7 | 7 | 0.054 | 0.579 |
| Model | Adaptive Rank | Classical Rank | Mean θ (n=5) | Accuracy |
|---|---|---|---|---|
| llama4-maverick-17b-instruct | 1 | 1 | 1.129 | 0.713 |
| deepseek.r1 | 2 | 2 | 0.954 | 0.699 |
| nova-micro | 3 | 3 | 0.819 | 0.689 |
| gemini-1.5-flash | 4 | 5 | 0.566 | 0.651 |
| gpt-4o-mini | 5 | 4 | 0.485 | 0.682 |
| gpt-4.1-nano | 6 | 6 | 0.404 | 0.632 |
| mixtral-8x7b-instruct | 7 | 7 | 0.241 | 0.601 |
| Model | Adaptive Rank | Classical Rank | Mean θ (n=5) | Accuracy |
|---|---|---|---|---|
| deepseek.r1 | 1 | 1 | 2.399 | 0.879 |
| llama4-maverick-17b-instruct | 2 | 2 | 1.238 | 0.733 |
| gemini-1.5-flash | 3 | 4 | 0.799 | 0.695 |
| gpt-4o-mini | 4 | 3 | 0.615 | 0.697 |
| gpt-4.1-nano | 5 | 5 | 0.536 | 0.631 |
| nova-micro | 6 | 6 | 0.187 | 0.568 |
| mixtral-8x7b-instruct | 7 | 7 | 0.123 | 0.523 |
| Model | Adaptive Rank | Classical Rank | Mean θ (n=5) | Accuracy |
|---|---|---|---|---|
| llama4-maverick-17b-instruct | 1 | 1 | 3.795 | 0.916 |
| deepseek.r1 | 2 | 2 | 3.588 | 0.910 |
| gemini-1.5-flash | 3 | 3 | 0.760 | 0.634 |
| gpt-4o-mini | 4 | 4 | 0.330 | 0.544 |
| gpt-4.1-nano | 5 | 5 | -0.684 | 0.424 |
| nova-micro | 6 | 6 | -0.832 | 0.407 |
| mixtral-8x7b-instruct | 7 | 7 | -1.007 | 0.380 |
The one exception was trismik/LayMed2025, where three models had nearly identical accuracy scores (within 0.01 of each other). Interestingly, the adaptive θ scores were better differentiated, suggesting that adaptive testing may surface subtle ability differences that static tests cannot.
Cost & Efficiency Gains
Let’s zoom in on trismik/FinRAG2025 to quantify time and cost savings. To compute accuracy on the full dataset across seven models, we spent approximately $21.72. By contrast, running one adaptive trial on all the models cost just $0.43. Even after five adaptive runs per model, the total cost for our adaptive tests was only $2.15 because on average, each adaptive run used just 1.7% of the full test set!
Our adaptive tests were 10x cheaper than full-dataset evaluations.
When evaluating repeatedly with top-tier LLMs, these savings become very significant.
Looking Ahead: Smarter, Scalable Evaluations
Adaptive testing is a new paradigm. Instead of relying on exhaustive, slow evaluations on static datasets, we can evaluate models more efficiently, and without significant loss of precision. Adaptive testing offers:
- 90% reduction in evaluation cost
- Faster iteration cycles
- No loss in ranking accuracy
As LLMs continue to evolve rapidly, evaluation tools must evolve too, because static benchmarks will not scale. Adaptive evaluation, powered by IRT, offers a future-proof solution.
We’re soon releasing our evaluation platform that supports adaptive tests. Join the waitlist here!